5 Questions To Ask While Considering Data Visualization Tools
If you are planning to choose a Business Intelligence tool for your Big Data solutions, it is important to evaluate which one is the best fit for your company and which one is not the best rated. An important criterion in the process is choosing the right visualization tool that helps you get the most out of Big Data and has well-defined functions.
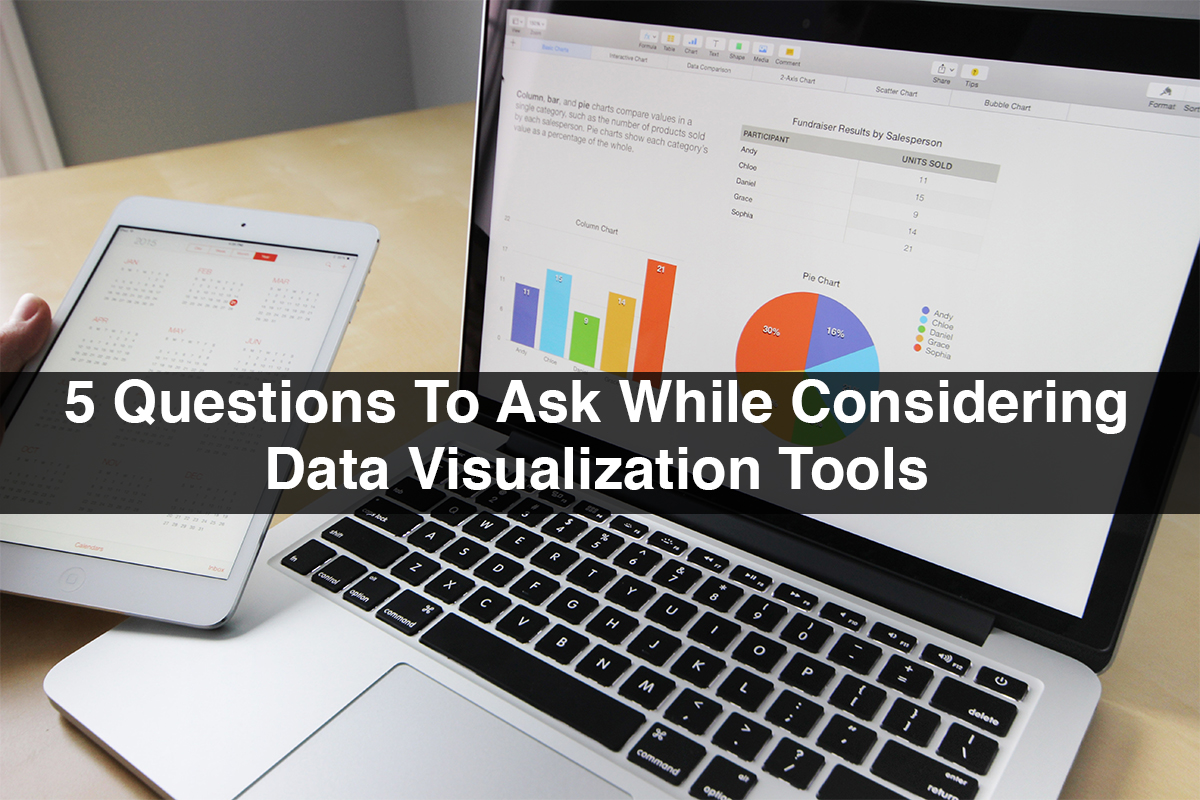
Data visualization tools
What do you imagine?
It is important to first understand why you are looking for a tool. If you plan to visualize internal data such as marketing, finance, etc, you should look for a tool that is compatible with your management system. For example, if you use a SAP ECC, Net Weaver system for internal data processing, SAP-based BI will work better for ease of implementation and reduced training costs. If the information is represented in a graphic form, a person can realize even complicated things more often and faster. Still, it requires no technical skills and is easy to learn using various tools like Power BI, Tableau.
What is the interface of the tool?
It is essential that the tool has an easy-to-use graphical user interface. Tools are meant to save time and make work easier. A well-designed tool that offers access to various options can be easily integrated into the process. Check that it has nice graphics options in case you need to visualize decision trees and so on. Data visualization is a method of converting raw data into visual forms such as tables, graphs, and maps. She quickly became famous for publishing information on the web. It helps across a range of industries, from business intelligence to better knowledge journalism, and brings vision to data.
Does it have the necessary support for visual discovery?
This can include something as simple as a comma separated values file, text, Excel and XML support. Apart from these basic things, you may need to check what programming language it supports. Your decision will depend on what your internal team is an expert at. Your team can get support for various popular programming languages like C++, Python, Java and Perl.
Is the price right
BI projects cost a lot, and the cost will largely depend on a number of criteria, such as the level of internal expertise and the end goal to be achieved. Visualization tools should not be judged solely on their price, but compared to how much is needed and what is provided. A good way to decide is to try a free trial version of the software and see if it works for you or not.
How flexible is the tool?
Make sure the visualization tool you’re looking for is flexible enough to accommodate these changes. Ask the provider how easy it is to upgrade the tool so you don’t hit a snag and require a complete overhaul in the near future. It also helps in making faster decisions and finding patterns, including new and hidden ones, to better understand difficult concepts.
Conclusion
Understanding these points will help you get started with your visualization tool list, but seeking the support of an experienced tool provider will help you complete it. Look for someone like us who is experienced in understanding the client’s requirements and providing a complete solution.


